Portfolio

Dashboards we have built for factories

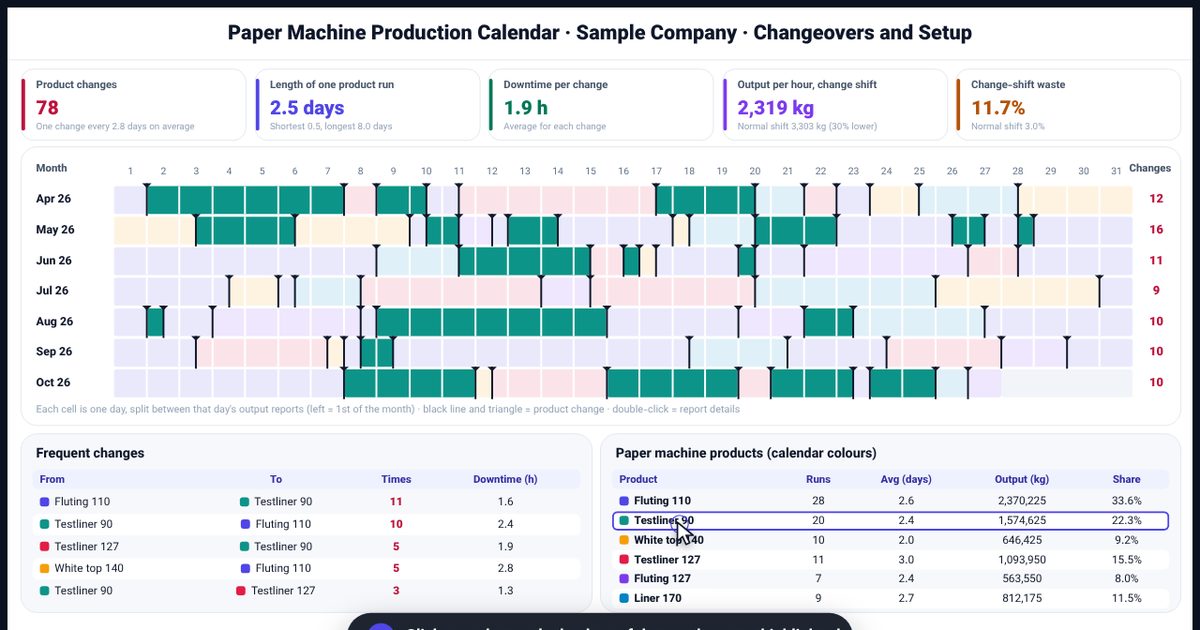
Each piece here is a real dashboard designed and built in Power BI for a production line. On each page you can watch its motion walkthrough and read which problem it solves, which metrics it uses and how decisions are made with it.

The company name, data and information shown are fictional; the dashboard structure and logic come from a real project.

  • Production line downtime dashboard in Power BI: net downtime, MTTR and MTBF on one page

    A dashboard for the maintenance team that places every stoppage notification of the month on a shift timeline, counts overlapping notifications only once, and shows net downtime, MTTR and MTBF down to a single piece of equipment.

    Industry: Continuous manufacturing (paper, packaging, process)

    • production downtime dashboard
    • downtime analysis
    • maintenance dashboard
    • MTTR and MTBF
    Read and watch
  • Production and staff share dashboard in Power BI: shift, work group and individual performance

    A dashboard for the production manager that puts output, scrap, roll grades and downtime of every shift side by side, compares work groups, and calculates each person’s share of output from their minutes on shift.

    Industry: Continuous manufacturing (paper, roll cutting and packing)

    • production staff performance dashboard
    • production staff KPIs
    • staff share of output
    • shift performance report
    Read and watch
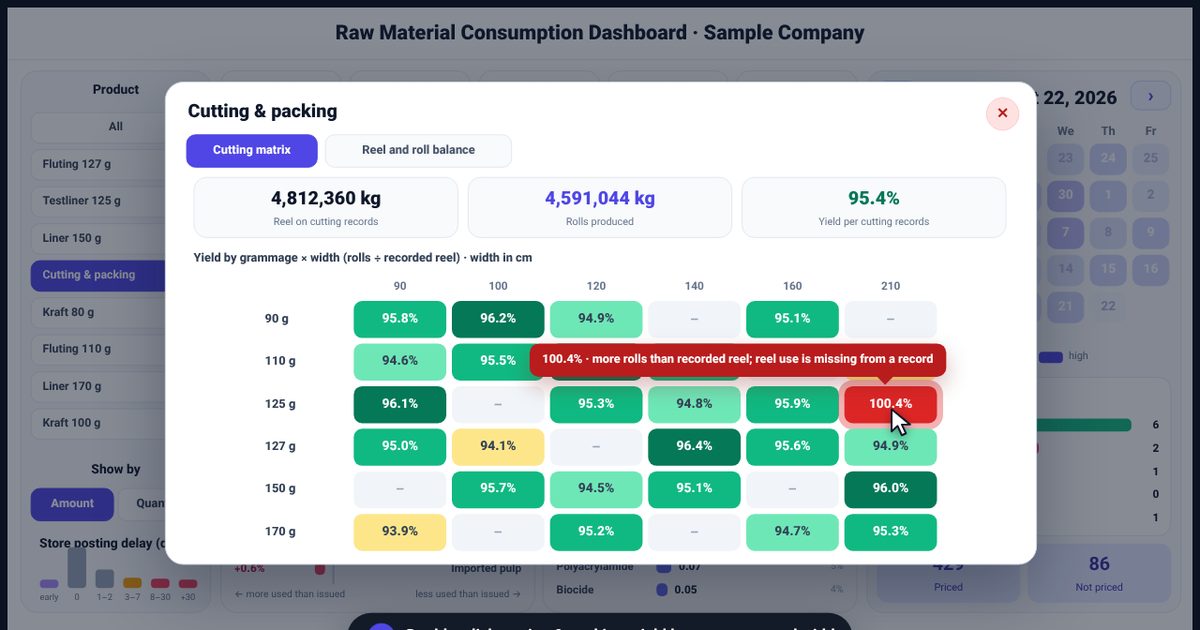
  • Raw material consumption dashboard in Power BI: spend, warehouse vs production variance and cutting waste

    A dashboard for finance and production managers that shows raw material consumption in value and quantity month by month next to reel output, reconciles warehouse issues with production confirmations, and derives true cutting waste from the balance of reels produced and rolls produced.

    Industry: Paper and board making, roll cutting and packaging

    • raw material consumption dashboard
    • material usage control in production
    • inventory vs production variance
    • production confirmation
    Read and watch
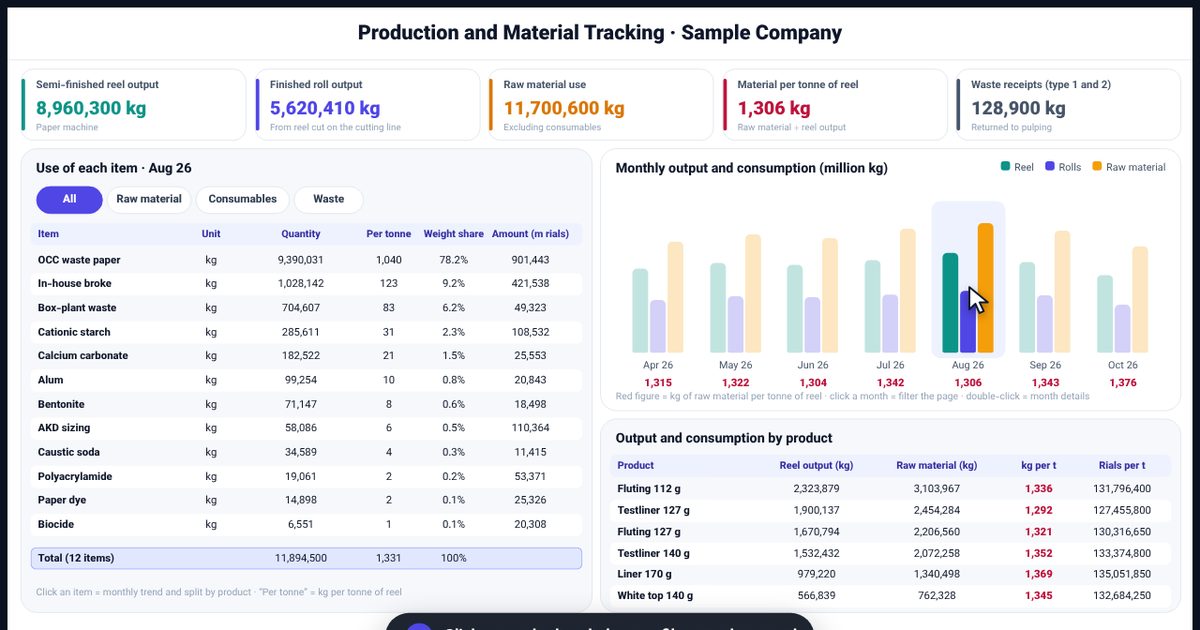
  • Production and material tracking dashboard in Power BI: material use per tonne and by product

    A dashboard for production managers and cost accountants that puts reel and roll output next to material use month by month, calculates material use per tonne for every month, product and item, and shows where an increase came from.

    Industry: Paper and board making, roll cutting and packaging

    • production and consumption tracking
    • material use per tonne
    • material usage ratio
    • product cost
    Read and watch

Do you have a management question your data should answer?

Fill in the analysis request form; we review your information before the first meeting so the conversation is precise from the start.